Features
Turning the Tide
Teams of researchers are collaborating to unlock the mysteries of the Gulf’s red tides.
| USF News
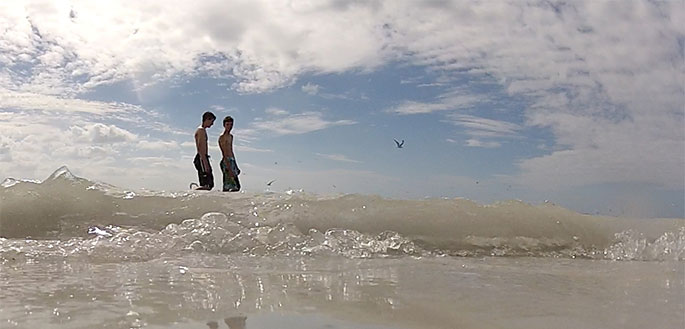
Photo by Katy Hennig | USF News
It’s enough to make you sick — a massive red tide bloom lurking off the coast of Southwest Florida — the kind of toxic bloom that could mean massive fish kills, beach closures, dead seabirds, contaminated shellfish and lost jobs.
For years, researchers at USF have been working to understand red tides in the Gulf of Mexico. To predict where and when the next red tide will occur. To determine what makes one red tide persist, while another quietly disappears.
They’ve partnered with scientists at the Florida Fish and Wildlife Commission’s (FWC) Fish and Wildlife Research Institute (FWRI), Mote Marine Laboratory and international researchers. They’ve tapped into new technologies.
And they know more today than ever before about the red tide beast.
Red tides occur naturally every year and can stretch for more than a hundred miles along shore. They can last for days, weeks or even months. The tides are a type of harmful algal bloom, a higher than usual concentration of naturally-occurring microscopic algae that grow in certain areas of the Gulf. The blooms can produce harmful or toxic effects on people, marine organisms and birds.
To date, about 85 different species of harmful algal blooms have been identified worldwide. Karenia brevis, one of the Gulf’s red tide species, is probably the region’s best known because it happens frequently and has nasty effects on wildlife and people.
And while at high concentrations the blooms can turn the water a reddish hue, red tides are often not red. They can appear greenish, brownish or purple, or even be so dark that the water appears black. In fact, the color of the water can remain unchanged or only slightly murky during a red tide bloom. Even so, the name sticks; scientists say it has become common language.
In 2007, Distinguished University Professors John Walsh and Robert Weisberg established the Center for Prediction of Red Tides at the USF College of Marine Science. At the center, a jointly-funded project between the college and FWRI, scientists are developing models capable of predicting and tracking Karenia brevis within the coastal waters of the southeastern United States.
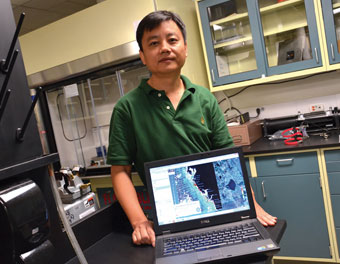
Associate professor Chuanmin Hu uses algorithms to interpret satellite images to study and predict red tide.
Photo by Katy Hennig | USF News
But it’s no small task, says USF research associate Jason Lenes. “In order to predict the bloom, you really have to have an understanding of how the bloom develops, how the bloom maintains itself and how the bloom terminates.”
That means bringing together physicists, fish biologists, remote sensing scientists, ecologists, public health specialists and toxicologists. It means tapping into federal and state resources.
“It’s very interdisciplinary,” Lenes adds. “Without bringing all of these people and resources together to address the problem, you’ll only get so far.”
In his laboratory, Lenes creates mathematical models to study how organisms like plants and tiny zooplankton live in the water, particularly during a harmful bloom event.
The models, in which organisms are represented by mathematical equations, are used as a predictive tool.
“Our ultimate goal is to try to provide forecasts like you would with a hurricane model that will show when and where the bloom is going to go and at what intensity,” he says.
And when it’s safe to go to the beach.
The current models can accurately forecast Karenia brevis on the West Florida shelf up to 3-1/2 days out. Lenes hopes to get that number between seven and 21 days, giving city officials, healthcare workers, hotels, restaurants, commercial fishermen, scientists and the public more time to prepare and plan for harmful bloom events.
The modeling data comes from water samples collected daily or near daily, especially during a bloom, by scientists at FWRI, Mote Marine Laboratory and the university. The samples provide cell counts of organisms present and other information to run the mathematical models.
Temperature and color of the ocean also factor in. The information comes from satellite images collected daily from two NASA satellites and several NOAA satellite sensors with ground-based tracking antennas installed at the Institute for Marine Remote Sensing (IMaRS), part of the College of Marine Science.
In the Optical Ocean Laboratory, directed by USF associate professor Chuanmin Hu, researchers use algorithms to interpret the data and develop images used by FWC and other agencies to inform the public and to study and predict red tide.
The satellite measurements are often the first to capture red tide blooms and the only way to determine the size of the blooms, Hu says. The near real-time information helps direct field activities, including where to sample and where to deploy underwater gliders.
“It’s a real collaboration between FWC, the operational agencies, Mote and USF researchers,” he says. “Everyone works together, from observation to modeling to information outreach.”
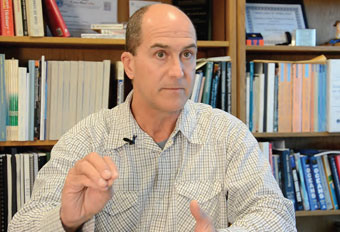
Biological oceanographer Frank Muller-Karger adds an international dimension to USF’s red tide research.
Photo by Katy Hennig | USF News
Researchers at IMaRS use a different set of algorithms to interpret the satellite data. Biological oceanographer and professor Frank Muller-Karger, who directs the nearly 20-year-old institute, says the satellites work like cameras with filters and provide information about what’s in the water. One advantage of operating the ground antennas, he adds, is the ability to get the satellite data out to the public within half an hour of the satellite passing over the Gulf.
“If there are a lot of these algae in the water they will change the color of the water to the point where you can see them from space,” he says. “We are trying to measure not only whether they are there or not, and when, but how concentrated they are. If they are very concentrated they can change the color of the water in different hues in a way that is very quantifiable and we can relate that measurement of the color.”
The satellite images also provide temperature data and clues about patterns, he says — currents and blooms, blooms associated with certain currents, river plumes that extend off shore, changes that occur with the seasons, and other long-term trends.
Scientists at IMaRS add an international dimension to the research.
“We are looking to see if there’s a connection between different parts of the Gulf and how the cells move in the water. We are looking at Mexico and the Yucatan Peninsula,” Muller-Karger says, adding that the institute is working with several Mexican government agencies to help researchers there interpret satellite data and plan a field component to identify and study red tides.
While satellites provide information from above, robot gliders — battery-powered, autonomous underwater vehicles — continuously profile the water column from the bottom to the surface, looking for signs of red tide and collecting data along the way.
The data provides important information about the properties of the water column. The information helps scientists understand exactly how the blooms initiate and evolve over time.
Chad Lembke, who oversees glider activities at the USF College of Marine Science Center for Ocean Technology, says the gliders provide a critical third dimension.
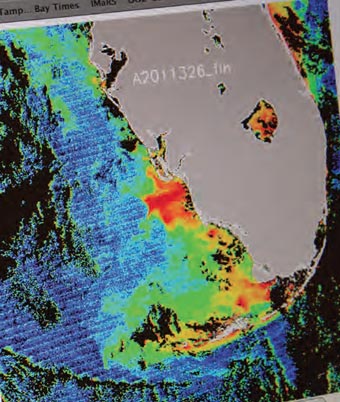
Satellite images are often the first to capture red tide blooms.
Photo by Katy Hennig | USF News
“Satellite imagery is two-dimensional imagery; it’s images of the surface. To get that third dimension, we go beneath the water all the way to the bottom,” he says. “It’s well known that water is not the same at the surface as it is all the way down. Water moves and it doesn’t move all in the same direction. There is stratification, there are currents that are going in different directions. Deep water can come up along the bottom or it can get pushed out depending on the circulation patterns.”
Another piece in the red tide puzzle.
Red tide isn’t a new phenomenon. The toxic blooms have been around since the 1500s, and typically rear their heads anywhere from the Gulf’s coasts and bays to tens of miles off shore. And while they typically happen every year between August and November, red tides can happen any time. Understanding how the blooms develop, move and maintain themselves is critical for mitigating the impacts of intense blooms on marine ecosystems, marine life, local economies and human health.
“You can’t remove it,” Hu says. “But if we know where it is, how long it will last and where it will move, we can plan for it.”
Less than six years after one of the worst red tides in the Gulf Coast’s history, the long-standing collaboration between USF researchers, government agencies and private institutions is yielding significant results.
Today, Lenes says, researchers have a better understanding of where blooms start, the three-dimensional nature of blooms and the sequence of events that trigger a bloom.
“In the scientific community, there is a mandate to share knowledge and there is an expectation of collaboration to help each other. We provide tools that allow our partners to be more efficient with their work, and they provide data that allows us to be more efficient in ours,” he says. “The ultimate goal is to provide resources and tools that are usable by society to improve everyday life.”